
Insight
Is It Actually Harder to Get Into College This Year? What the Data Says
Applications hit a record 10.8 million last season. The number that matters for your child is a different one.

Every fall, a version of the same headline circulates: applications are up again,
admission is more competitive than ever, and your child is walking into the hardest
cycle in history. This year the headline has a real number behind it. Common App
processed 10,786,782 first-year applications in the 2025 to 2026 season, the largest
volume in the platform's fifty-year history.
That number is accurate. It is also close to useless for deciding what your family
should do this fall. The more useful figures are buried further down in the same
report, and several of them point in the opposite direction from the headline.
The record number is mostly an illusion
Common App's end-of-season report, published August 20, 2026, is the most complete
public picture of who applies to college in the United States. It covers 1,146
member institutions (Common App, End-of-Season Report, 2026). Two numbers in it tell
very different stories.
Applications rose 6 percent. Applicants rose 2 percent.
Total application volume climbed from 10,157,068 to 10,786,782, an increase of about
6 percent. But the number of actual human beings applying went from 1,495,475 to
1,527,328, an increase of roughly 2 percent.
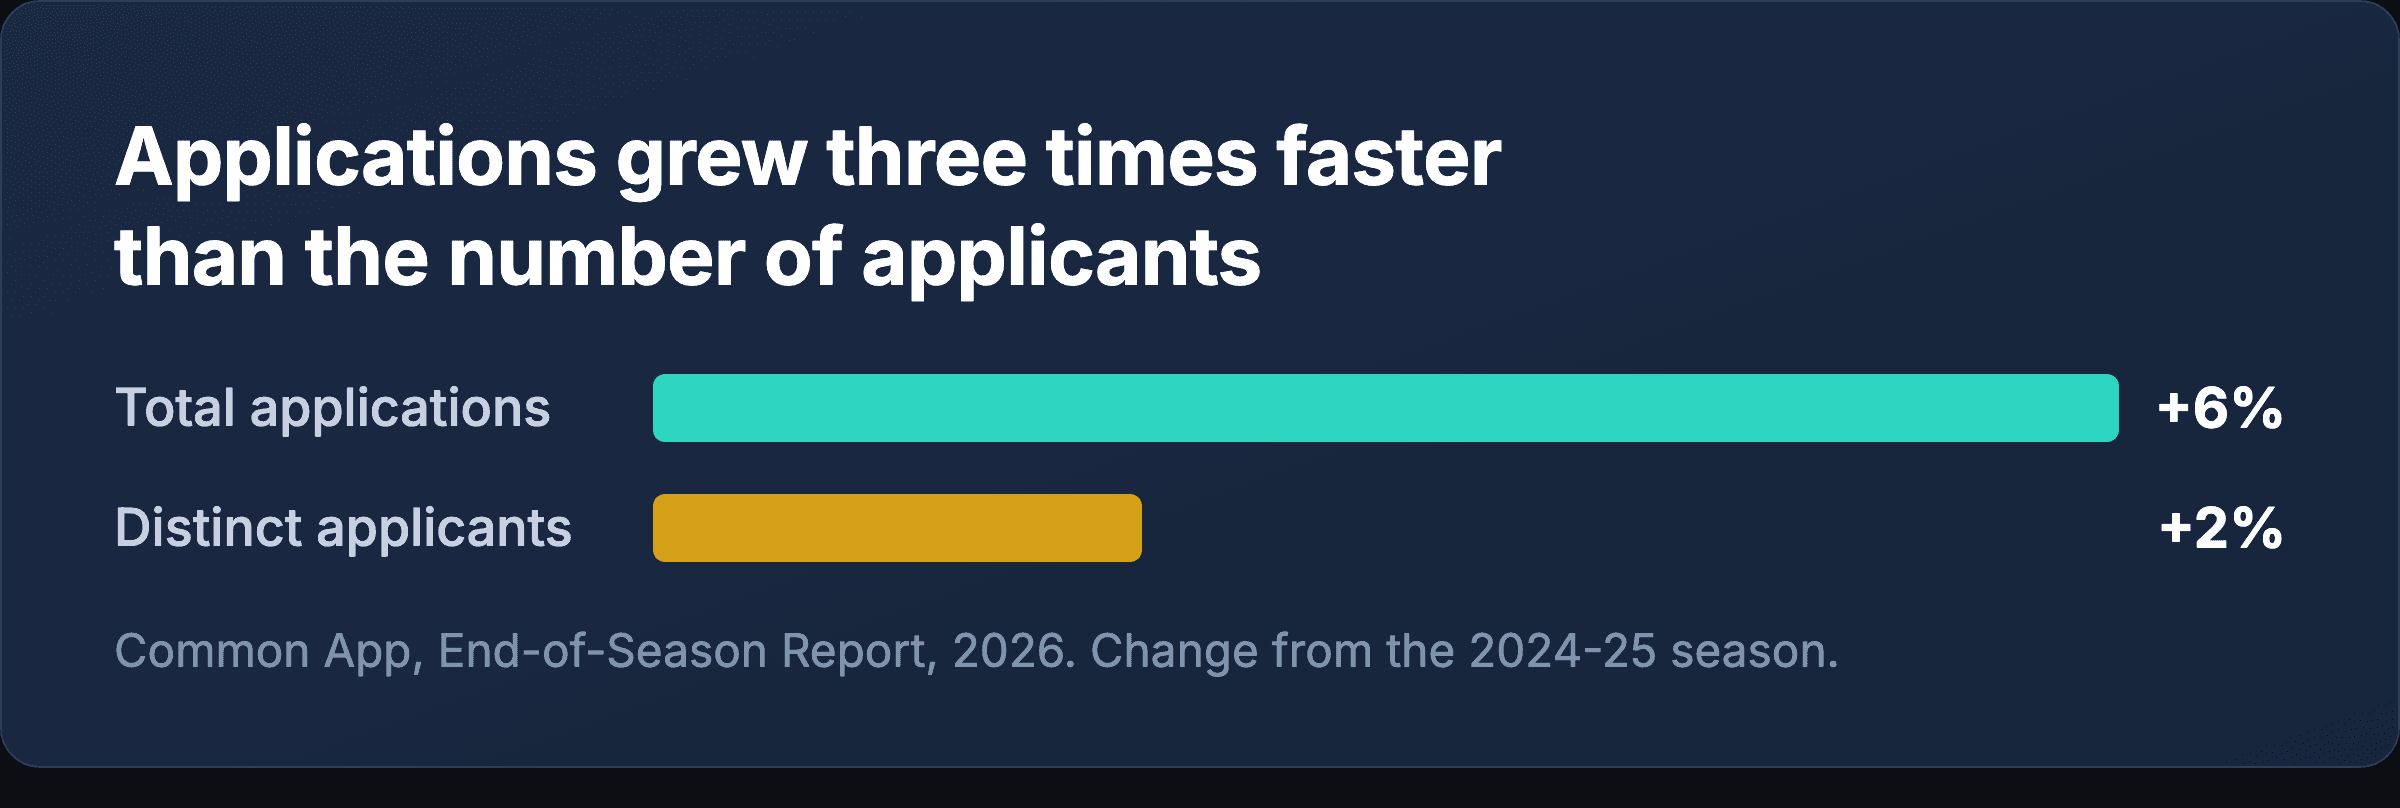
The gap between those two figures is the whole story. Applications grew three times
faster than applicants did. That is not a surge of new competitors. It is roughly
the same group of students, each sending out more applications.
The average student applied to 7.06 colleges
Per-applicant volume rose from 6.79 to 7.06 institutions, up 4 percent. Some of
that is simply that there are more colleges to apply to: Common App membership grew
4 percent, from 1,097 institutions to 1,146.
So when you read that applications hit an all-time high, the accurate translation
is closer to this: a slightly larger group of students applied to a slightly larger
group of colleges, and each student cast a slightly wider net. That is a meaningful
trend for admissions offices trying to predict their yield. It is not evidence that
your child faces a dramatically harder field than last year's seniors did.
Growth was slowest exactly where you would expect it to be fastest
This is the finding most likely to surprise you, and it is the one worth carrying
into your family's conversations this fall.
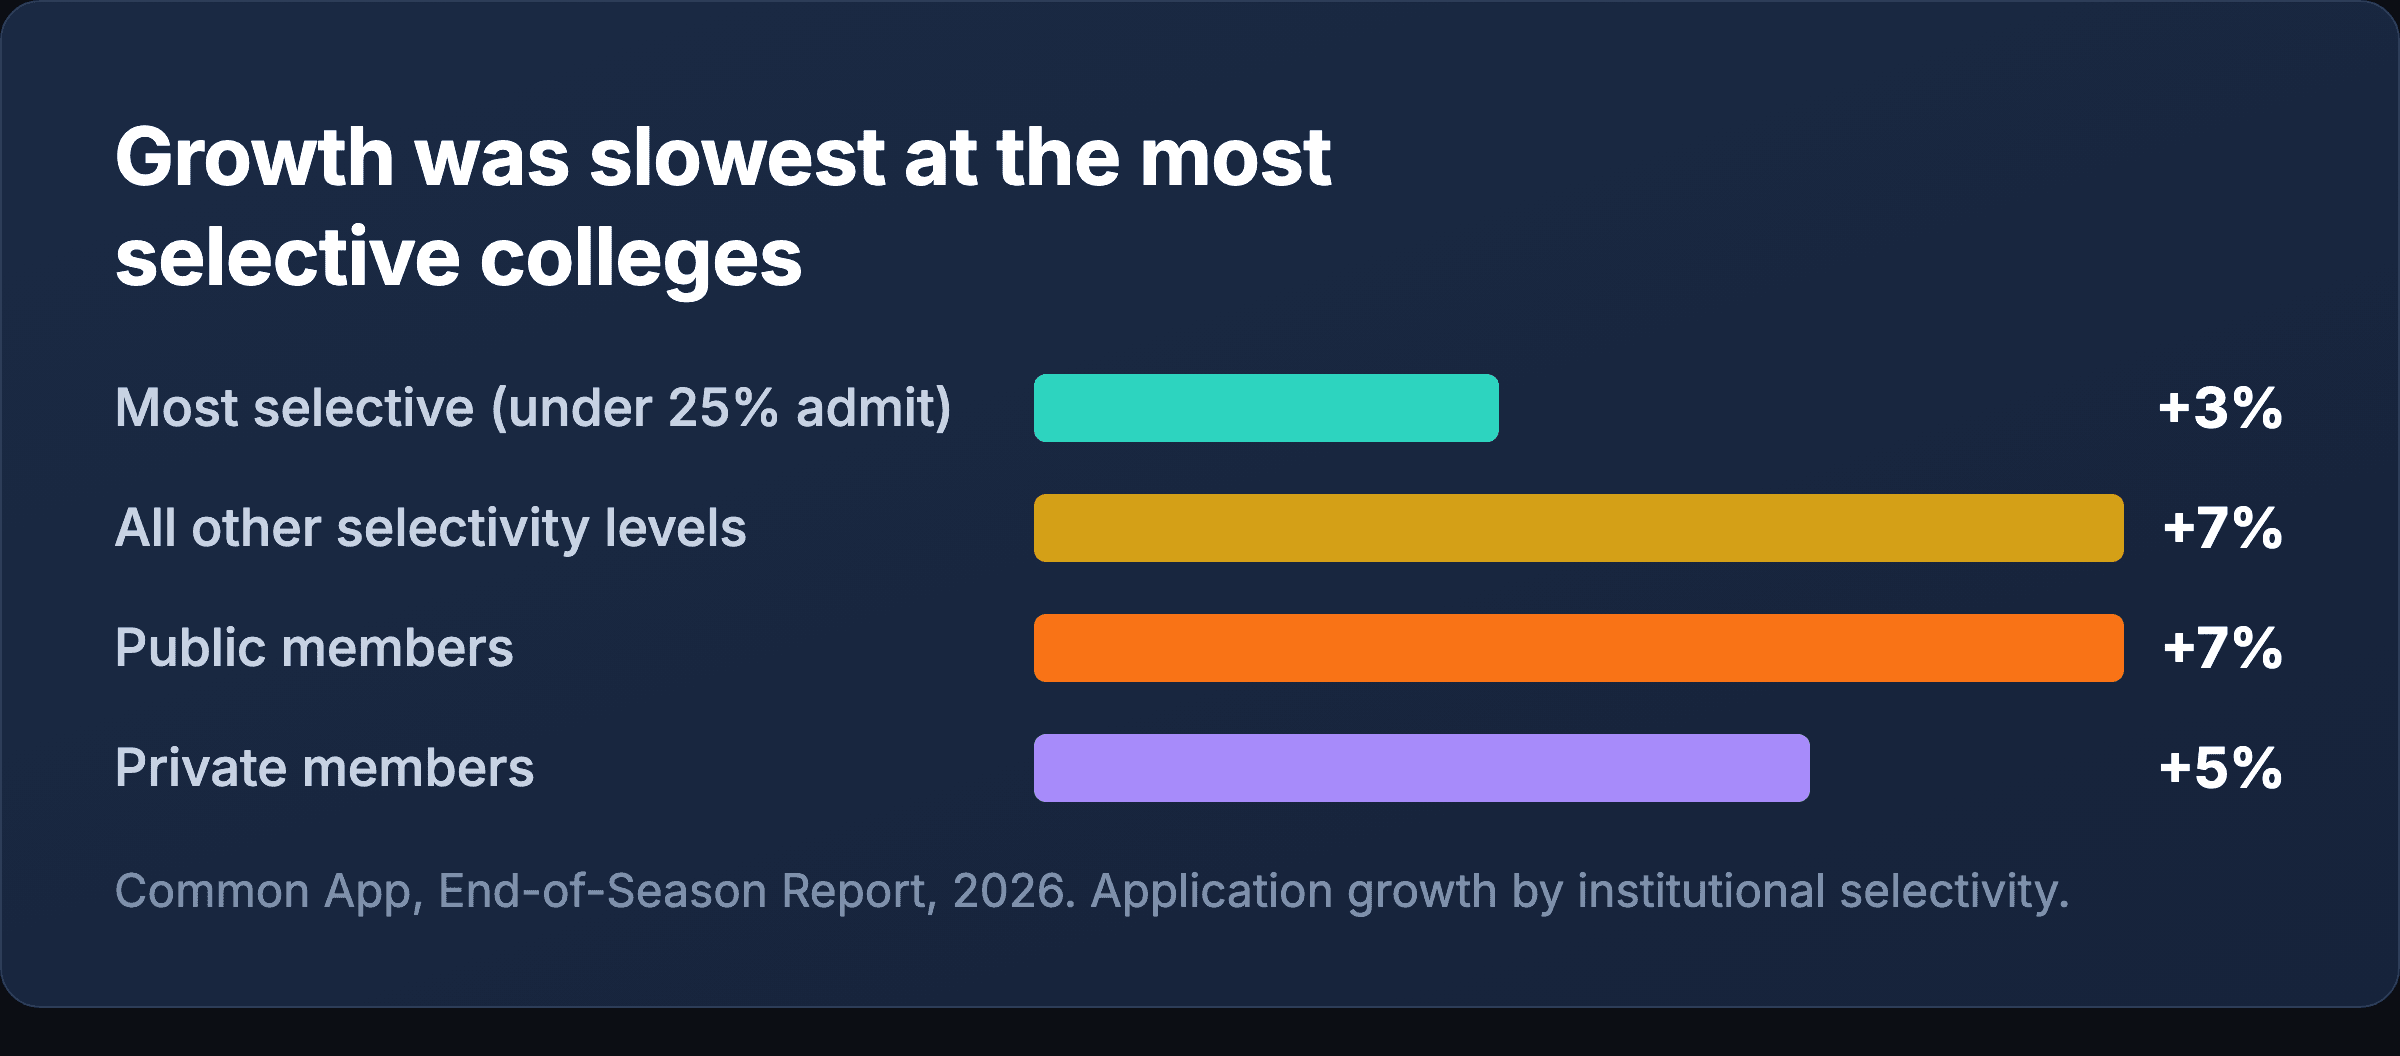
Common App sorts member institutions by selectivity. The most selective category
covers colleges admitting fewer than 25 percent of applicants. Application growth
to that group was 3 percent, the slowest of any selectivity level. Every other
category grew between 5 and 8 percent (Common App, End-of-Season Report, 2026).
The schools everyone assumes are being buried under an avalanche grew more slowly
than the rest of the market.
Public universities grew faster than private ones
Applications to public members rose 7 percent, against 5 percent for private
members. Combined with the selectivity finding, the pattern is consistent: growth is
concentrated in large public institutions and less selective colleges, not in the
handful of famous names that dominate the conversation at dinner tables.
Why the perception runs the other way
Selective colleges publish their application totals and their admit rates, and those
numbers get written about. A regional public university that grew 8 percent does not
issue a press release. The visible data is drawn from the least representative slice
of the market, which is how a category growing at 3 percent comes to feel like the
whole story.
Who is applying is changing more than how many
The demographic movement in this report is larger than the volume movement, and it
gets far less attention.
Lower income and first generation applicants are growing fastest
Applicants eligible for a Common App fee waiver grew 6 percent. Applicants not
eligible grew 0 percent. Students from below-median-income ZIP codes grew 8 percent,
against 2 percent for students from above-median-income ZIP codes. First-generation
applicants grew 6 percent while continuing-generation applicants declined slightly.
Essentially all of the applicant growth on the platform came from students who have
historically been underrepresented in selective admissions.
International applications dropped sharply
The number of international applicants fell 10 percent. Applications from Asia
declined 11 percent and from Africa 17 percent, with India down 15 percent and Ghana
down 34 percent. Applicants from the Americas moved the other way, rising 5 percent.
For a domestic applicant, a 10 percent decline in international applicants is not
nothing. International students compete for seats in the same pools at many
institutions, particularly in engineering and the sciences.
The map is shifting
Applicants from small towns grew 9 percent, rural areas 8 percent, and micropolitan
areas 7 percent, against 3 percent from metropolitan areas. The Southwest was the
fastest-growing region at 9 percent, with Texas at 9 percent and Mississippi the
fastest-growing state in the country at 28 percent.
The ten-year trend explains the admit rates
Zoom out from a single season and the picture gets clearer, because the thing
families actually feel is a decade of accumulated change rather than one year of it.
Applications grew 154 percent. Applicants did not.
Since the 2016 to 2017 season, total applications on the platform are up 154
percent. Applications per applicant are up 49 percent. Those two figures together
are the real explanation for a decade of falling admit rates at visible colleges.
An admit rate is a fraction. When the denominator grows because each student files
half again as many applications as students did ten years ago, the fraction shrinks
without anything about the difficulty changing. A college that admitted 20 percent
of applicants in 2016 and 12 percent today may be admitting a very similar number of
very similar students.
For the first time in nearly a decade, the pipeline shrank
Buried in this year's report is a number that has not appeared before. The count of
account creators intending to enroll the following year fell slightly, from
2,564,311 to 2,560,533. The decline is under 1 percent, so the size of it does not
matter. What matters is the direction, because it is the only year-over-year decline
in account creators since the 2016 to 2017 season.
Common App attributes the slowdown to two things: the decline in international
applicants, and projected decreases in the number of United States high school
graduates beginning in 2025 (Common App, End-of-Season Report, 2026). Demographers have been forecasting that second one for
years. It is now arriving.
What a shrinking pipeline means for a current sophomore or junior
Nothing dramatic, and nothing this fall. But if you have a younger child in the
house, the decade your family is planning into looks different from the decade that
produced the anxiety. A smaller graduating cohort applying to a larger set of member
institutions is a gentler market than the one your older child is entering, not a
harsher one.
The testing reversal most families have not registered
If you take one operational fact from this report into your fall, make it this one.
Score reporters now outnumber non-reporters
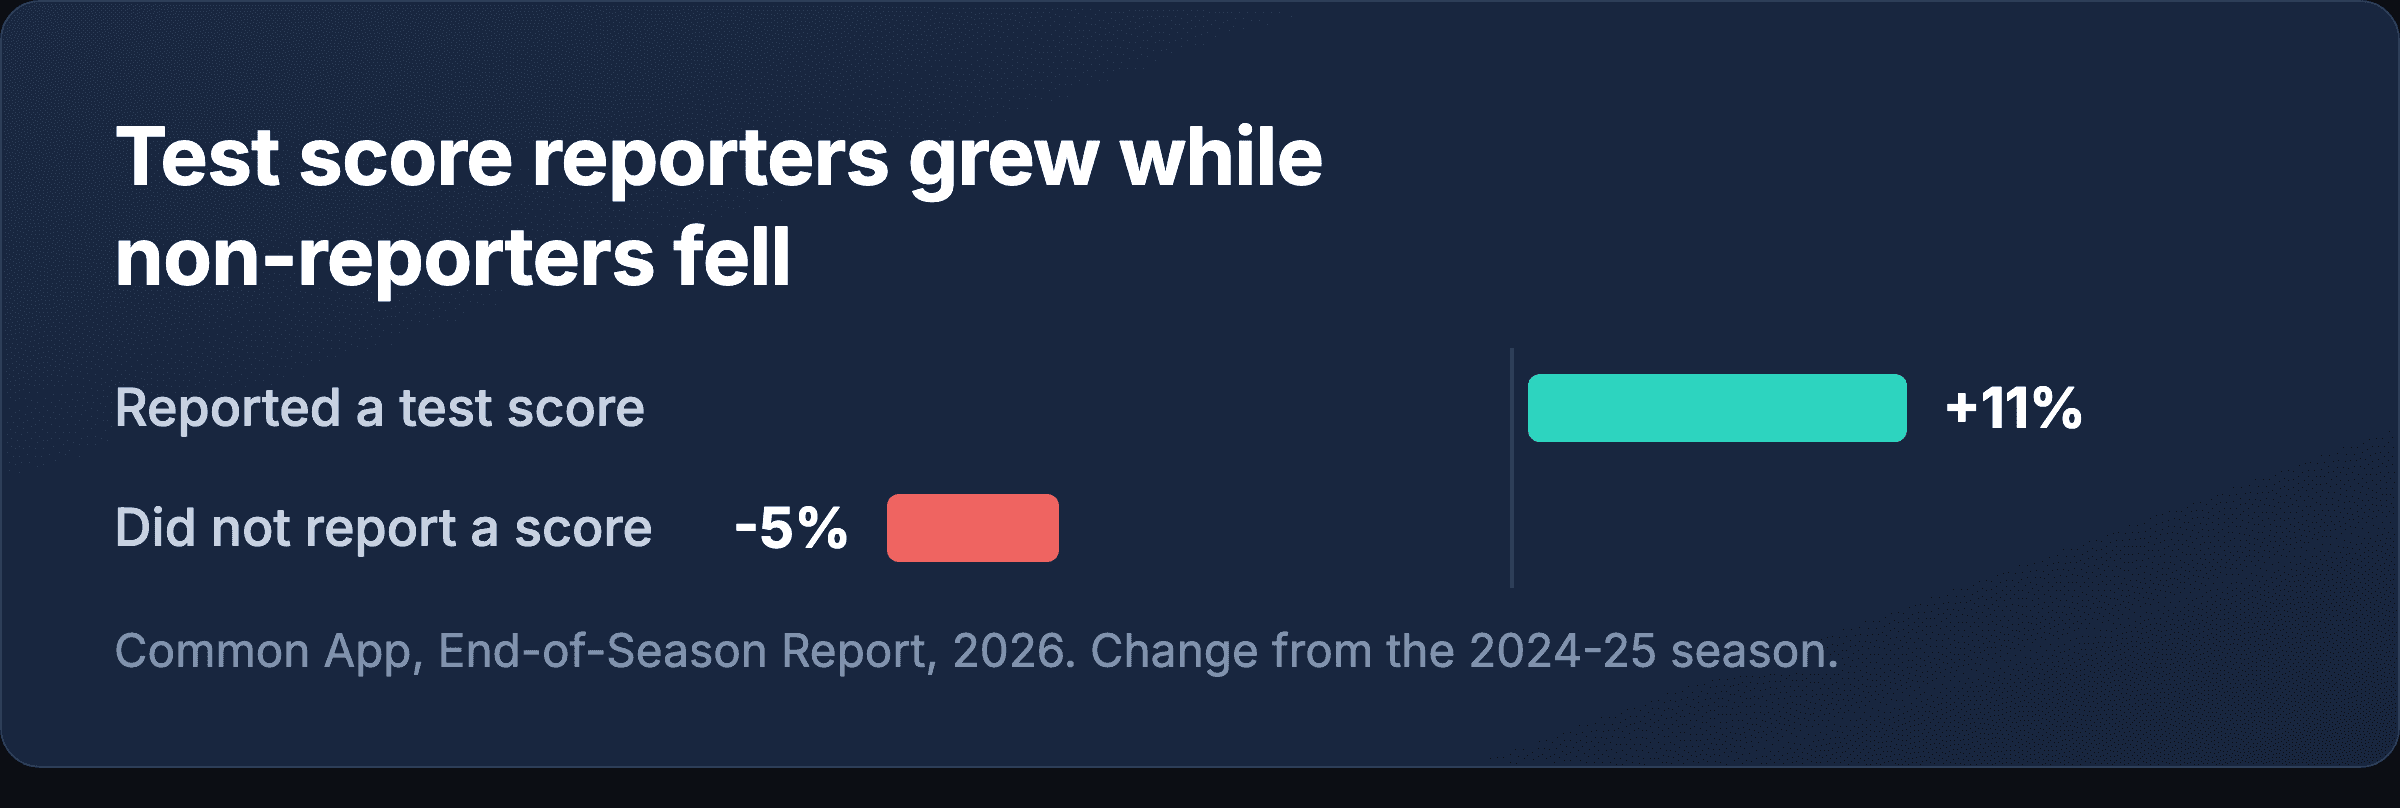
For the first time since the 2019 to 2020 season, the number of applicants
submitting a standardized test score exceeded the number applying without one.
Applicants reporting a score grew 11 percent. Applicants not reporting a score fell
5 percent (Common App, End-of-Season Report, 2026).
That is a genuine reversal of the pattern that held through the test-optional era.
But almost no college requires a score
Here is the part that makes the reversal confusing. Only 5 percent of Common App
members require a test score to submit an application. A decade ago that figure was
around 55 percent. It bottomed out at 4 percent in the 2023 to 2024 season and has
barely moved since (Common App, End-of-Season Report, 2026).

So the requirement did not come back. Student behavior changed inside a policy that
mostly did not.
What that means for your child
Test-optional means optional, and the data says most families are now choosing to
opt in. The practical question is no longer whether the school requires a score. It
is whether a submitted score helps this particular application at this particular
college. A score that sits comfortably inside a school's published middle 50 percent
generally helps. A score below that range generally does not, and withholding it
remains a legitimate choice at 95 percent of institutions.
Worth knowing: first-generation students, students eligible for fee waivers, and
students from lower-income communities remain less likely to report a score, even
as reporting grew across every one of those groups.
What actually changed on the Common App this year
The application itself opened August 1, 2026, and the changes are modest.
The essay prompts did not change
Common App announced on February 27, 2026 that all seven personal statement prompts
would carry over unchanged, citing feedback from students, counselors, teachers and
colleges (Common App, Announcing the 2026-2027 Essay Prompts, 2026). If your child started drafting over the summer against last year's
prompts, that work is still good.
Activities and position titles were reworked
The activities section has new categories and revised language, including options
for career readiness or practicums, paid employment, and hobbies. The position or
leadership title field, previously mandatory, is now a yes or no question. Students
who answer yes get 50 characters to name the title.
That 50-character limit is small. It rewards a specific, plain title over an
inflated one.
Smaller changes worth a minute
New account creators now have to verify their email address, though rollover
accounts are unaffected. Fee waiver policies display more transparently across the
application. Students can list up to 10 siblings, raised from 5. Independent students
no longer see family questions that do not apply to them. Sixty-four new institutions
joined the platform (Collegewise, The 2026-2027 Common App, 2026).
What this should change about your fall
Build the list around fit, not fear
The data does not support treating this cycle as uniquely brutal. It supports the
opposite reading at most institutions. If your child's list was built by starting
with the most selective schools and working down, the numbers in this report are an
argument for rebuilding it from the middle out.
Watch the application-count trap
The average applicant now files 7.06 applications. It is tempting to read that as a
target. It is not. The growth in per-student application volume is a large part of
why admit rates at visible schools keep falling: more applications spread across the
same number of seats produces a lower percentage without any change in how hard it
is to be admitted. Adding four more applications to a list mostly adds four more
essays, and the marginal ones are usually the weakest.
Confirm testing decisions before October
Given the reversal in reporting behavior, this is worth settling early rather than
in the week before a deadline. Pull the published middle 50 percent range for each
school on the list, compare it against your child's best score, and make the call
school by school rather than as a single blanket policy.
Frequently Asked Questions
Are acceptance rates falling because more students are applying?
Partly, but not in the way most families assume. The number of students is up only 2
percent. The number of applications each student sends is up 4 percent. A falling
admit rate driven by the same students applying to more places does not mean the
applicant pool got stronger or larger in any meaningful sense.
Should my child submit test scores if the college does not require them?
It depends on the score and the school, not on a general rule. Compare the score to
each college's published middle 50 percent range. Inside that range, submitting
generally helps. Below it, withholding remains a real option at the 95 percent of
Common App members that do not require a score.
Did the Common App essay prompts change for this cycle?
No. Common App confirmed on February 27, 2026 that all seven prompts stay the same
for 2026 to 2027.
How many colleges should my child apply to?
There is no correct number, and the platform average of 7.06 is a description rather
than a recommendation. A list that is well constructed at eight schools beats a list
of fifteen where a third of the supplements were written in a hurry.
Does the drop in international applicants help domestic students?
At some institutions, modestly. International applicants fell 10 percent, and at
schools where domestic and international candidates compete in the same pool, that
is a small tailwind. It is not large enough to build a strategy around.
Sources
Common App. End-of-season report, 2025-2026: First-year application trends. August
20, 2026.
https://www.commonapp.org/reports/end-season-report-2025-2026-first-year-application-trends/
Common App. Announcing the 2026-2027 Common App essay prompts. February 27, 2026.
https://www.commonapp.org/blog/announcing-2026-2027-common-app-essay-prompts/
Collegewise. The 2026-2027 Common App: What's New, Mistakes to Avoid & Expert Tips.
2026. https://collegewise.com/blog/common-app
Insights for Students and Families
The most useful thing you can do with this report is let it lower the temperature.
The record-application headline is real and mostly irrelevant to your household. The
findings that should shape your fall are quieter: growth concentrated away from the
most selective schools, a testing reversal that shifts a decision most families were
treating as settled, and a modest set of Common App changes that reward specificity
over inflation.
The families who navigate this well are usually not the ones working hardest. They
are the ones who decided early what they were actually optimizing for, then stopped
reacting to headlines built from the least representative data in the market.
If you are working through a college list, a testing decision, or a set of
supplements this fall and want a second read from someone who does this every year,
NextBound works with students and families through exactly these questions. Reach
out and we will tell you honestly what we think, including when the answer is that
you are already on the right track.